How to Automate Client Reporting with n8n (Build a Custom PDF Engine) – 30 Days of n8n & Automation – Day 22

Welcome back to Day 22 of the 30 Days of n8n & Automation series here on whoisalfaz.me.
I expect you already had this thought of automate client reporting with n8n, if you’re following us from Day 1. Yesterday, on Day 21: Automating Personal Branding, we built a “Digital Twin” to handle your social presence. Today, we turn our focus outward to the lifeblood of any service business: The Client.
If you run an agency or manage stakeholders, you likely dread the “End of Month” reporting cycle. You log into Google Analytics, take a screenshot. You log into Facebook Ads Manager, take a screenshot. You paste them into a Canva slide, export as PDF, and email it.
This process is slow, unscalable, and frankly, boring.
Worse, you might be paying $50-$300/month for tools like AgencyAnalytics or Databox just to generate these charts.
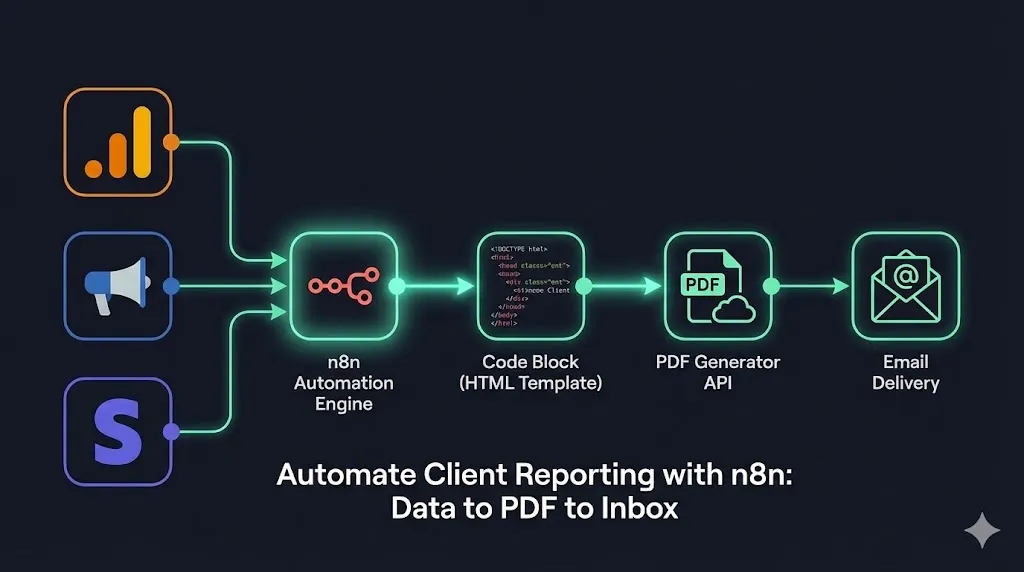
Today, I am going to show you how to automate client reporting with n8n. We will build a system that pulls data from the pipelines we built earlier in this series, injects it into a branded HTML template, converts it to a professional PDF, and delivers it to your client’s inbox—touched by human hands only if you want it to be.
Why You Should Automate Client Reporting with n8n
The “SaaS Trap” is real. Agencies often subscribe to reporting tools that offer “white labeling,” but you are ultimately limited by their templates.
By building your own reporting engine in n8n, you gain three massive advantages:
- Infinite Customization: You can combine data from any source. Want to show a correlation between “New YouTube Subscribers” (from Day 21) and “Stripe Revenue”? You can. No SaaS tool allows that level of cross-platform logic.
- Cost Savings: You eliminate the monthly “per client” reporting fee.
- Data Reliability: As we discussed on Day 17: Production Workflows, owning your data pipeline ensures you aren’t reliant on a third party’s uptime.
The Architecture: From JSON to PDF
Before we build, we must understand the data flow. Generating a PDF in automation isn’t as simple as “clicking print.” We need to structure a pipeline.
Here is the stack we will use:
- The Data Layer: We will pull metrics using the nodes we set up on Day 20 (GA4) and Day 13 (Facebook Lead Ads).
- The Logic Layer: n8n will calculate “Month-over-Month” (MoM) growth.
- The Presentation Layer: We will use HTML & CSS to design the report. This allows for pixel-perfect branding.
- The Render Layer: We will use an API (like APITemplate.io or a self-hosted Gotenberg instance) to convert that HTML into a PDF.
- The Delivery Layer: Email via SMTP/Gmail.
Step 1: Aggregating the Data
To automate client reporting with n8n, we first need the numbers.
We start with a Schedule Trigger set to run on the 1st of every month at 09:00 AM.
Pulling Google Analytics 4 Data
Referencing our work from Day 20, we use the GA4 node.
- Metric:
activeUsers,screenPageViews,conversions. - Date Range:
Last Month.
Pulling Facebook Ads Data
Referencing Day 13, we use the HTTP Request node (Graph API) to get ad performance.
- Metric:
spend,impressions,cpc,actions(leads).
The “Set” Node (Data Normalization)
This is a pro tip. Don’t pass raw API data to your PDF generator. It’s messy. Use a Set node to clean it up and define your variables.
JavaScript
// Example in n8n "Set" Node or Code Node
return {
  json: {
    client_name: "Acme Corp",
    report_date: "January 2026",
    total_spend: $1,250.00,
    total_leads: 45,
    cpa: $27.77,
    traffic: 15400,
    mom_growth: "+12%" // Calculated in a previous function node
  }
}
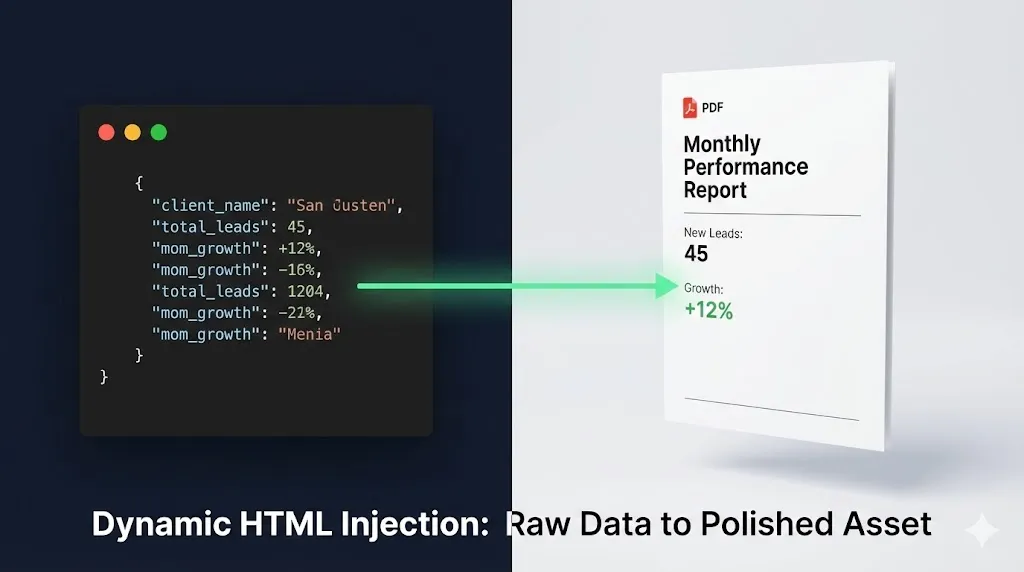
Step 2: The HTML Template (The “Secret Sauce”)
This is where you provide real value. Instead of a boring table, we use an HTML template.
In n8n, we create a Code Node (or a Template node). We will treat this as a string of HTML. We use Handlebars syntax (e.g., {{total_leads}}) to inject the data from Step 1.
The “Agency-Grade” Code Snippet
Copy this structure into your node. This uses Flexbox for a modern layout that converts perfectly to PDF.
HTML
<html>
<head>
<style>
  body { font-family: 'Helvetica', sans-serif; color: #333; }
  .header { background: #000; color: #fff; padding: 20px; text-align: center; }
  .grid { display: flex; justify-content: space-between; margin-top: 40px; }
  .card { border: 1px solid #ddd; padding: 20px; width: 30%; text-align: center; border-radius: 8px; }
  .number { font-size: 36px; font-weight: bold; color: #ff6b6b; }
  .label { font-size: 14px; text-transform: uppercase; letter-spacing: 1px; }
</style>
</head>
<body>
  <div class="header">
    <h1>Monthly Performance Report</h1>
    <p>Prepared for: {{client_name}} | {{report_date}}</p>
  </div>

  <div class="grid">
    <div class="card">
      <div class="number">{{total_leads}}</div>
      <div class="label">New Leads</div>
    </div>
    <div class="card">
      <div class="number">{{cpa}}</div>
      <div class="label">Cost Per Acquisition</div>
    </div>
    <div class="card">
      <div class="number">{{traffic}}</div>
      <div class="label">Website Traffic</div>
    </div>
  </div>

  <p>Summary: Growth is {{mom_growth}} compared to last month.</p>
</body>
</html>
This approach allows you to fully brand the report. You can add your logo, change the hex codes to match your client’s brand colors dynamically, and adjust the layout without asking a developer.
Step 3: Generating the PDF (The Render Layer)
Now we need to turn that HTML string into a .pdf file.
You have two main options here:
- Self-Hosted (Gotenberg): If you are running n8n via Docker (as we recommended in the setup guide), you can spin up a Gotenberg container. This is free and open-source.
- API Service (APITemplate.io / PDFMonkey): This is easier for beginners.
For this tutorial, to automate client reporting with n8n efficiently, we will use the HTTP Request node to hit a PDF generation API (like APITemplate or similar).
- Node: HTTP Request
- Method: POST
- URL:
https://api.pdf-service.com/v1/create - Body Parameters:
html: [The HTML string from Step 2]format: “A4”margin: “2cm”
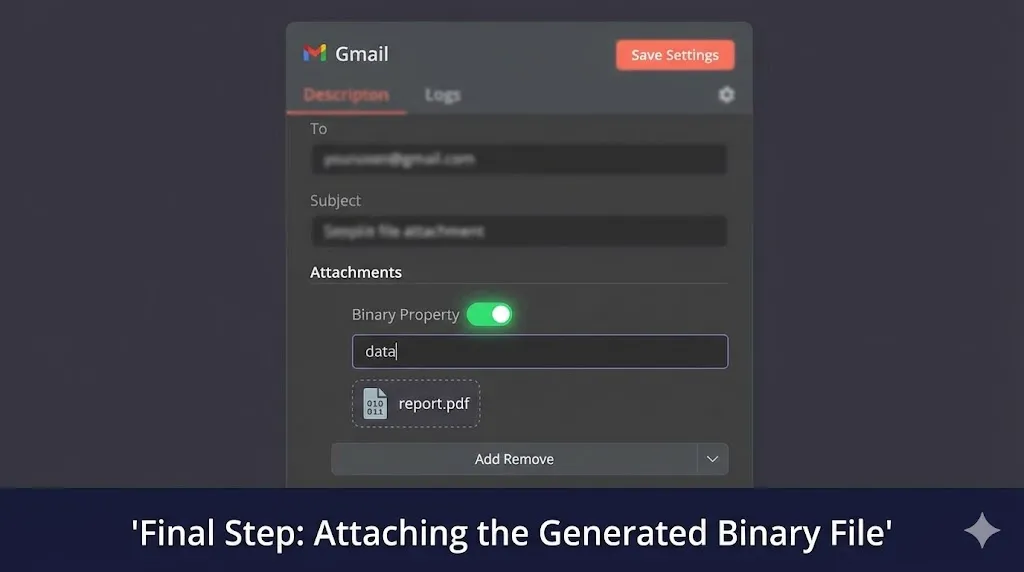
Handling Binary Data
This is the most common point of failure. The API will return a file stream (binary data), not JSON.
- In the HTTP Request node, ensure you toggle “Response Format” to “File”.
- Name the binary property
data.
If you miss this step, n8n will try to parse the PDF as text and crash your workflow.
Step 4: Automated Delivery
The final step in our mission to automate client reporting with n8n is delivery.
We use the Gmail or Brevo node (refer to Day 12 for SMTP setup).
- To:
{{client_email}} - Subject:
Monthly Report: {{report_date}} - Body: “Hi {{First Name}}, Please find attached your performance report for this month. We saw a {{mom_growth}} increase in traffic!”
- Attachments: Select the
databinary property from the previous node.
Pro Tip: The “Human Review” Switch
If you aren’t ready to trust the robot fully, change the recipient email to Your Own Email.
- The workflow runs on the 1st.
- You receive the PDF.
- You review it.
- You forward it to the client.
This still saves you 95% of the work (gathering data and formatting) while keeping a safety layer.
Advanced: Adding Charts (Chart.js)
Text metrics are great, but clients love charts. Since we are using HTML, we can embed Chart.js via a QuickChart.io link.
In your data preparation step, you can construct a URL that generates a chart image: https://quickchart.io/chart?c={type:'bar',data:{labels:['Jan','Feb'],datasets:[{label:'Users',data:[120, 150]}]}}
Then, in your HTML template, simply add: <img src="{{chart_url}}" width="100%" />
This renders a visual graph inside your PDF without needing complex JavaScript rendering engines.
Conclusion: Your Reporting is Now an Asset
By learning to automate client reporting with n8n, you have done more than just save time. You have transformed a “chore” into a consistent, branded, and reliable product.
You are no longer the agency owner frantically taking screenshots at 11 PM on the 31st. You are the architect of a system that delivers value like clockwork.
This workflow, combined with the Rank Tracker (Day 16) and Social Listening (Day 21), gives you a complete picture of your digital performance, fully automated.
What’s Next? We have covered data, content, and reporting. But what happens when things go wrong? Tomorrow, on Day 23, we are going to build “The Error Handler.” I will show you how to build a global error workflow in n8n that catches failed executions and alerts you via Discord or Slack with the exact error log—so you can fix bugs before your clients even notice.
See you in the workflow editor.
External Resources:
- Handlebars.js Documentation – Learn more about templating logic.
- QuickChart.io – For generating chart images for your PDFs.
- Gotenberg PDF Engine – For the self-hosting enthusiasts.