Automated Marketing Reporting: Send Weekly Lead Summaries with n8n – 30 Days of n8n & Automation – Day 14

Dashboards are where data goes to die.
We build them with the best intentions. We set up Looker Studio, Tableau, or complex CRM dashboards. But let’s be honest: nobody logs in to check them. Clients lose their login details, and sales managers are too busy closing deals to interpret line graphs.
If you want your stakeholders to actually value your results, you must push the data to where they live: their inbox.
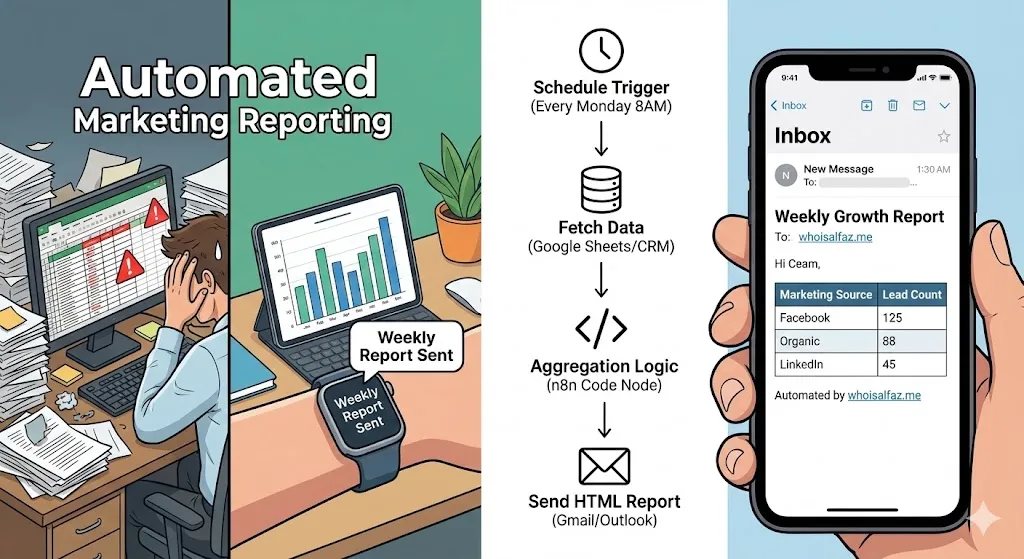
Automated marketing reporting changes the dynamic from “passive tracking” to “active accountability.” When a CEO or Agency Client wakes up every Monday to a clean summary of exactly how many leads came in, where they came from, and how many were qualified, the perceived value of your service skyrockets.
In this Day 14 guide of 30 Days of n8n & Automation, we are building a “Push” reporting engine. We will aggregate data from the past week, summarize it by source, and deliver a beautiful HTML report via email—automatically.
Throughout this guide, examples come from the actual reporting pipelines Alfaz Mahmud Rizve builds for high-ticket agencies at whoisalfaz.me.
Why “Push” Reporting Beats “Pull” Dashboards
A “Pull” system (like a dashboard) requires willpower. You have to remember to log in, filter the dates, and interpret the data. A “Push” system (like automated marketing reporting) requires zero effort. It arrives like a newspaper.
For agencies, this is a retention tool. If your client doesn’t hear from you, they assume you aren’t working. A weekly automated report saying “We generated 43 leads this week” is a heartbeat signal that proves your value.
At whoisalfaz.me, Alfaz Mahmud Rizve follows the “Monday Morning Rule”: The most important metrics must be in the client’s inbox before they finish their first coffee.
Architecture: The “Aggregation Pattern”
Unlike previous days where we reacted to a single event (New Lead), today we are processing batches of data.
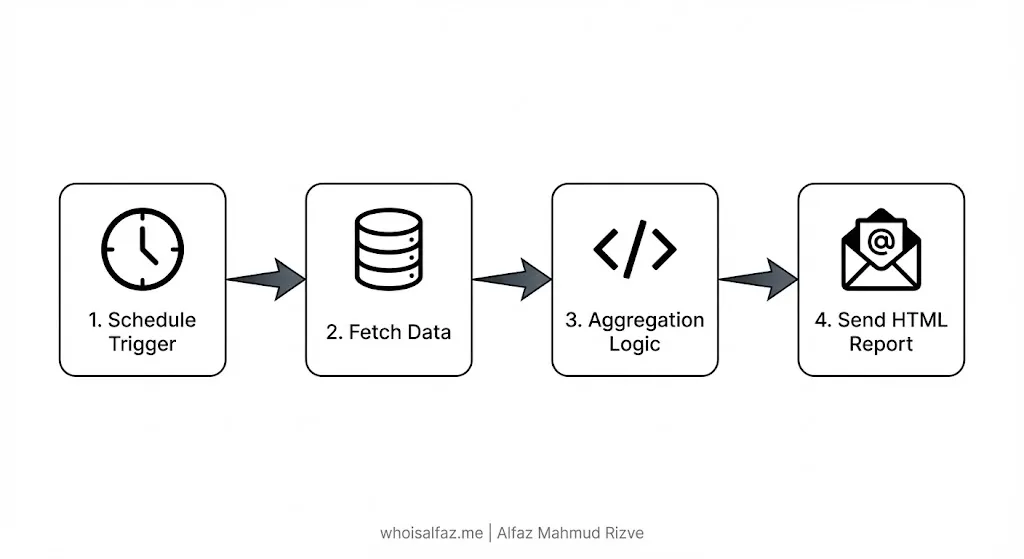
The Workflow Logic:
- Trigger: A Schedule Node runs every Monday at 8:00 AM.
- Fetch: We pull all leads created in the last 7 days from the database (Google Sheets or CRM).
- Transform: We use a Code Node to group them by “Source” (FB, LinkedIn, Organic) and count the totals.
- Format: We convert that raw JSON data into a clean HTML table.
- Deliver: We send a professionally formatted email via Gmail or Outlook.
Step-by-Step: Building Your Automated Marketing Reporting Engine
Let’s open n8n and build this reporting machine.
Phase 1: The Schedule & The Fetch
Node 1: Schedule Trigger
- Trigger Interval:
Weeks. - Day:
Monday. - Hour:
8(or9). - Why: Consistency is key. Your report should be as reliable as the sunrise.
Node 2: Date & Time (The “Lookback” Window)
- Action: Calculate the date range.
- Operation:
Format a Date. - Value:
{{ $now.minus({days: 7}) }}. - Format:
YYYY-MM-DD. - Note: We need this date to tell our database “Give me everything since last Monday.”
Node 3: Google Sheets (or HubSpot/Pipedrive)
- Operation:
Get ManyorGet All. - Filter: Use the “Filter” option.
- Logic:
Created_Atis after{{ $json.date }}(from Node 2). - Result: You now have a JSON array of every lead generated in the reporting period.
Phase 2: The Aggregation (The Brains)
This is where n8n shines. Most automated marketing reporting tools charge extra for “custom logic.” In n8n, it’s just a few lines of JavaScript. We don’t want to send a list of 50 names; we want a summary.
Node 4: Code Node (The Summarizer) We need to group leads by source.
- Code Snippet:
JavaScript
// Simple grouping logic for Marketing Reporting
const leads = $input.all().map(item => item.json);
const summary = {};

leads.forEach(lead => {
  // Ensure your column in Sheets/CRM is named 'Source'
  const source = lead.Source || 'Unknown';
  summary[source] = (summary[source] || 0) + 1;
});

// Convert back to n8n format for the HTML node
return Object.keys(summary).map(key => ({
  json: { "Marketing Source": key, "Lead Count": summary[key] }
}));
- Output:
[{ "Marketing Source": "Facebook Ads", "Lead Count": 12 }, { "Marketing Source": "SEO", "Lead Count": 5 }]
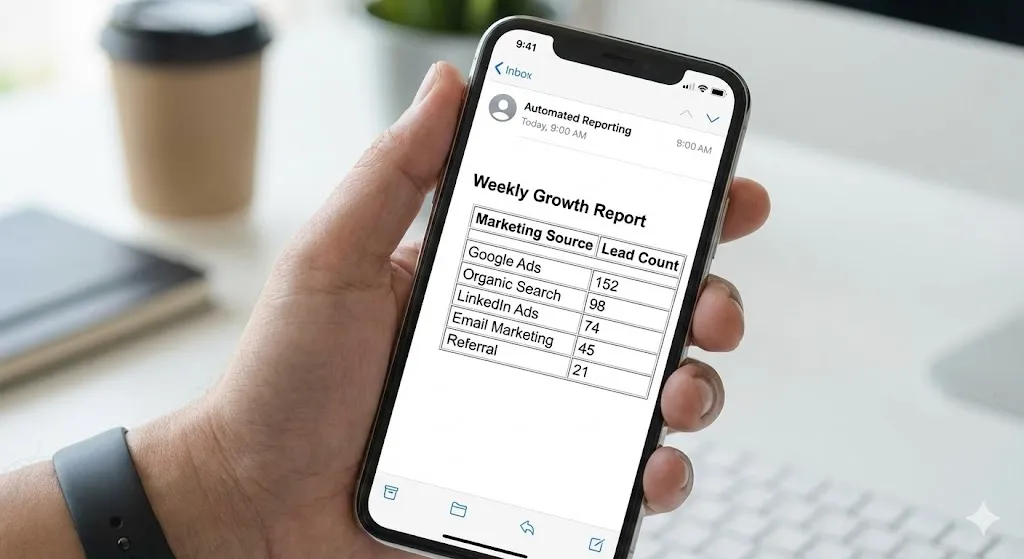
Phase 3: The Formatting (Making it Beautiful)
Sending raw JSON is ugly. Executives want tables.
Node 5: HTML (or “Create HTML Table”)
- Node Type:
HTML(or utilize theSpreadsheet Filenode if you want to attach a CSV). - Operation:
Convert to HTML Table. - Input Data: The output from the Code node.
- Styling: Add some simple CSS to make the headers bold (e.g.,
style="border: 1px solid #ddd; padding: 8px;").
Phase 4: Delivery
Node 6: Gmail / Outlook
- Recipient: The Client, CEO, or Sales Manager.
- Subject:
Weekly Marketing Report: {{ $today.format('MMM DD') }} - Body (HTML):Good morning, Here is your Automated Marketing Report for the past 7 days. Total Leads: {{ $input.all().length }} {{ $json.html_table }} Automated by whoisalfaz.me
Real-World Use Case: The “Health Score” Highlight
At whoisalfaz.me, we take automated marketing reporting a step further. We don’t just count leads; we grade them.
In the aggregation step, we calculate a “Lead Health Score”:
- Qualified Leads: Count of leads where
Status= “Qualified”. - Response Rate: Percentage of leads who replied (using data from Day 12).
- Speed to Lead: Average time between “Created” and “First Call”.
If the “Speed to Lead” is over 1 hour, we set a flag to highlight that row in RED in the HTML email. This turns the report from a “summary” into a “call to action.”
Common Mistakes with Automated Reporting
- Sending Empty Reports: If you had 0 leads this week, sending a blank table looks broken. Use an If node to check
if leads.length == 0and send a different email (“Quiet week, let’s review ad spend”) instead. - Timezone Confusion: Ensure your Schedule trigger matches your client’s timezone, not the server’s. A Monday report arriving on Sunday night confuses everyone.
- Broken HTML: Email clients (especially Outlook) are notoriously bad at rendering complex HTML. Keep your tables simple. No Javascript, no complex CSS grids.
Checklist: Go Live
- ✅ Date Filter: Verified the workflow only pulls the last 7 days of data.
- ✅ Math Check: Manually counted the leads in the sheet vs. the report to ensure accuracy.
- ✅ Mobile Test: Opened the email on a phone to ensure the table doesn’t break the layout.
- ✅ Zero-Data Handler: Added logic for what happens if there are no leads.
Series Context
This article is part of the 30 Days of n8n & Automation series at whoisalfaz.me.
Earlier posts you should read next:
- Day 13: Facebook Lead Ads Automation – The raw data source feeding this report.
- Day 8: Capture n8n lead data to Google Sheets – How to build the database we are querying today.
If you are ready to stop being a data clerk and start being a strategic partner, build this automated marketing reporting workflow today.
Then, subscribe to the newsletter at whoisalfaz.me so you do not miss tomorrow’s Day 15 automation in the 30 Days of n8n & Automation series from Alfaz Mahmud Rizve.